Week 5 Friday#
Machine Learning: Overview of the whole picture#
Possible hierarchies of machine learning concepts:
Problems:
Supervised Learning (Regression, Classification)
Unsupervised Learning (Dimension Reduction, Clustering)
Models:
(Supervised) Linear Regression, Logistic Regression, K-Nearest Neighbor (kNN) Classification/Regression, Decision Tree, Random Forest, Support Vector Machine…
(Unsupervised) K-means,Hierachical Clustering, Principle Component Analysis, Manifold Learning (MDS, IsoMap, Diffusion Map, tSNE), Autoencoder…
Algorithms: Gradient Descent, Stochastic Gradient Descent (SGD), Back Propagation (BP), Expectation–Maximization (EM)…
For the same problem, there may exist multiple models to discribe it. Given the specific model, there might be many different algorithms to solve it.
Why there is so much diversity? The following two fundamental principles of machine learning may provide theoretical insights.
Bias-Variance Trade-off: Simple models – large bias, low variance. Complex models – low bias, large variance
No Free Lunch Theorem: (in plain language) There is no one model that works best for every problem. (more quantitatively) Any two models are equivalent when their performance averaged across all possible problems. –Even true for optimization algorithms.
import pandas as pd
import altair as alt
import seaborn as sns
Recap#
This week we’ve started the Machine Learning portion of the class. The most important points so far:
The most common scikit-learn workflow: import, instantiate, fit, predict.
Using scikit-learn for linear regression.
Linear regression is a model for regression, because we are trying to predict a continuous value. (You might think that’s obvious since it’s called linear regression, but next week we will learn logistic regression, which is actually used for classification.)
The coefficients found in linear regression have real-world interpretations, similar to partial derivatives.
Motivating Example III: Single-variable Polynomial Regression (Special Case of Multivariable Linear Regression)#
Problem#
Given the training dataset \((x^{(i)},y^{(i)}), i= 1,2,..., N\), this time with \(y^{(i)}\in \mathbb{R}\) and \(x^{(i)}\in\mathbb{R}\), we fit the single-variable polynomial function of \(p\)-th order
Remark: A basic conclusion in numerical analysis is that with N points, we can have a polynomial of order (N-1) that fits every point perfectly.
Strategy#
Single-variable polynomial regression is a special case of multi-variable linear regression, because we can construct a dataset of \(p\) variables by defining each row as \((x,x^{2}, ..., x^{p})\) for each observation at \(x\).
Load the mpg dataset from Seaborn and drop missing values. Name the result
df.
df = sns.load_dataset("mpg").dropna(axis=0).copy()
df.head(5)
| mpg | cylinders | displacement | horsepower | weight | acceleration | model_year | origin | name | |
|---|---|---|---|---|---|---|---|---|---|
| 0 | 18.0 | 8 | 307.0 | 130.0 | 3504 | 12.0 | 70 | usa | chevrolet chevelle malibu |
| 1 | 15.0 | 8 | 350.0 | 165.0 | 3693 | 11.5 | 70 | usa | buick skylark 320 |
| 2 | 18.0 | 8 | 318.0 | 150.0 | 3436 | 11.0 | 70 | usa | plymouth satellite |
| 3 | 16.0 | 8 | 304.0 | 150.0 | 3433 | 12.0 | 70 | usa | amc rebel sst |
| 4 | 17.0 | 8 | 302.0 | 140.0 | 3449 | 10.5 | 70 | usa | ford torino |
Find a degree 3 polynomial to model “mpg” as a function of “horsepower”.
(Warning 1. These coefficients are not as interpretable as they are for linear regression. Warning 2. We can automate some of the following steps using a scikit-learn class called PolynomialFeatures.)
degs = range(1,4)
Here are the degrees we want to allow. You can think of this like the list [1, 2, 3], but it is not a list, it is a Python range object.
# degrees we want
degs = range(1,4)
for d in range(1,4):
    df[f"h{d}"] = df["horsepower"]**d
Notice how the "h2" column is the square of the "h1" column, and the "h3" column is the cube of the "h1" column. Also notice how the "h1" column is identical to the "horsepower" column, just because df["horsepower"]**1 is the same as df["horsepower"].
df
| mpg | cylinders | displacement | horsepower | weight | acceleration | model_year | origin | name | h1 | h2 | h3 | |
|---|---|---|---|---|---|---|---|---|---|---|---|---|
| 0 | 18.0 | 8 | 307.0 | 130.0 | 3504 | 12.0 | 70 | usa | chevrolet chevelle malibu | 130.0 | 16900.0 | 2197000.0 |
| 1 | 15.0 | 8 | 350.0 | 165.0 | 3693 | 11.5 | 70 | usa | buick skylark 320 | 165.0 | 27225.0 | 4492125.0 |
| 2 | 18.0 | 8 | 318.0 | 150.0 | 3436 | 11.0 | 70 | usa | plymouth satellite | 150.0 | 22500.0 | 3375000.0 |
| 3 | 16.0 | 8 | 304.0 | 150.0 | 3433 | 12.0 | 70 | usa | amc rebel sst | 150.0 | 22500.0 | 3375000.0 |
| 4 | 17.0 | 8 | 302.0 | 140.0 | 3449 | 10.5 | 70 | usa | ford torino | 140.0 | 19600.0 | 2744000.0 |
| ... | ... | ... | ... | ... | ... | ... | ... | ... | ... | ... | ... | ... |
| 393 | 27.0 | 4 | 140.0 | 86.0 | 2790 | 15.6 | 82 | usa | ford mustang gl | 86.0 | 7396.0 | 636056.0 |
| 394 | 44.0 | 4 | 97.0 | 52.0 | 2130 | 24.6 | 82 | europe | vw pickup | 52.0 | 2704.0 | 140608.0 |
| 395 | 32.0 | 4 | 135.0 | 84.0 | 2295 | 11.6 | 82 | usa | dodge rampage | 84.0 | 7056.0 | 592704.0 |
| 396 | 28.0 | 4 | 120.0 | 79.0 | 2625 | 18.6 | 82 | usa | ford ranger | 79.0 | 6241.0 | 493039.0 |
| 397 | 31.0 | 4 | 119.0 | 82.0 | 2720 | 19.4 | 82 | usa | chevy s-10 | 82.0 | 6724.0 | 551368.0 |
392 rows × 12 columns
We are now ready to perform polynomial regression. We want to find coefficients for a model of the form \(y \approx m_3 x^3 + m_2 x^2 + m_1 x + b\), where y is the “mpg” value and where x is the “horsepower” value. Notice that this is identical to finding coefficients for a model of the form \(y \approx m_3 h_3 + m_2 h_2 + m_1 h_1 + b\), which is exactly what we can do using linear regression.
Important summary: if you can perform linear regression using multiple columns, then you can also perform polynomial regression. Reason: simply include powers as new input columns, like what we are doing here.
from sklearn.linear_model import LinearRegression
reg = LinearRegression()
Here are the columns we are going to use. This will be a linear regression with three input variables.
pred_cols = [f"h{d}" for d in degs]
pred_cols
['h1', 'h2', 'h3']
Generate the training and test dataset by random splitting:
from sklearn.model_selection import train_test_split
X_train, X_test, y_train, y_test = train_test_split(df[pred_cols], df["mpg"], test_size=0.1, random_state=42)
help(train_test_split)
Help on function train_test_split in module sklearn.model_selection._split:

train_test_split(*arrays, test_size=None, train_size=None, random_state=None, shuffle=True, stratify=None)
    Split arrays or matrices into random train and test subsets.

    Quick utility that wraps input validation and
    ``next(ShuffleSplit().split(X, y))`` and application to input data
    into a single call for splitting (and optionally subsampling) data in a
    oneliner.

    Read more in the :ref:`User Guide <cross_validation>`.

    Parameters
    ----------
    *arrays : sequence of indexables with same length / shape[0]
        Allowed inputs are lists, numpy arrays, scipy-sparse
        matrices or pandas dataframes.

    test_size : float or int, default=None
        If float, should be between 0.0 and 1.0 and represent the proportion
        of the dataset to include in the test split. If int, represents the
        absolute number of test samples. If None, the value is set to the
        complement of the train size. If ``train_size`` is also None, it will
        be set to 0.25.

    train_size : float or int, default=None
        If float, should be between 0.0 and 1.0 and represent the
        proportion of the dataset to include in the train split. If
        int, represents the absolute number of train samples. If None,
        the value is automatically set to the complement of the test size.

    random_state : int, RandomState instance or None, default=None
        Controls the shuffling applied to the data before applying the split.
        Pass an int for reproducible output across multiple function calls.
        See :term:`Glossary <random_state>`.

    shuffle : bool, default=True
        Whether or not to shuffle the data before splitting. If shuffle=False
        then stratify must be None.

    stratify : array-like, default=None
        If not None, data is split in a stratified fashion, using this as
        the class labels.
        Read more in the :ref:`User Guide <stratification>`.

    Returns
    -------
    splitting : list, length=2 * len(arrays)
        List containing train-test split of inputs.

        .. versionadded:: 0.16
            If the input is sparse, the output will be a
            ``scipy.sparse.csr_matrix``. Else, output type is the same as the
            input type.

    Examples
    --------
    >>> import numpy as np
    >>> from sklearn.model_selection import train_test_split
    >>> X, y = np.arange(10).reshape((5, 2)), range(5)
    >>> X
    array([[0, 1],
           [2, 3],
           [4, 5],
           [6, 7],
           [8, 9]])
    >>> list(y)
    [0, 1, 2, 3, 4]

    >>> X_train, X_test, y_train, y_test = train_test_split(
    ...     X, y, test_size=0.33, random_state=42)
    ...
    >>> X_train
    array([[4, 5],
           [0, 1],
           [6, 7]])
    >>> y_train
    [2, 0, 3]
    >>> X_test
    array([[2, 3],
           [8, 9]])
    >>> y_test
    [1, 4]

    >>> train_test_split(y, shuffle=False)
    [[0, 1, 2], [3, 4]]
X_train.shape
(352, 3)
X_test.shape
(40, 3)
reg.fit(X_train, y_train)
LinearRegression()In a Jupyter environment, please rerun this cell to show the HTML representation or trust the notebook.
On GitHub, the HTML representation is unable to render, please try loading this page with nbviewer.org.
LinearRegression()
X_train.index
# Make predictions for the training and test sets
y_train_pred = reg.predict(X_train)
y_test_pred = reg.predict(X_test)

# Add predictions back to the respective rows in 'df'
df.loc[X_train.index, 'pred'] = y_train_pred
df.loc[X_test.index, 'pred'] = y_test_pred

df
Create a new column ‘label’ in ‘df’ to indicate whether a row is in the training or test set:
df.loc[X_train.index, "label"] = 'train'
df.loc[X_test.index, "label"] = 'test'
df
| mpg | cylinders | displacement | horsepower | weight | acceleration | model_year | origin | name | h1 | h2 | h3 | pred | label | |
|---|---|---|---|---|---|---|---|---|---|---|---|---|---|---|
| 0 | 18.0 | 8 | 307.0 | 130.0 | 3504 | 12.0 | 70 | usa | chevrolet chevelle malibu | 130.0 | 16900.0 | 2197000.0 | 17.148526 | test |
| 1 | 15.0 | 8 | 350.0 | 165.0 | 3693 | 11.5 | 70 | usa | buick skylark 320 | 165.0 | 27225.0 | 4492125.0 | 13.921521 | train |
| 2 | 18.0 | 8 | 318.0 | 150.0 | 3436 | 11.0 | 70 | usa | plymouth satellite | 150.0 | 22500.0 | 3375000.0 | 14.966220 | train |
| 3 | 16.0 | 8 | 304.0 | 150.0 | 3433 | 12.0 | 70 | usa | amc rebel sst | 150.0 | 22500.0 | 3375000.0 | 14.966220 | train |
| 4 | 17.0 | 8 | 302.0 | 140.0 | 3449 | 10.5 | 70 | usa | ford torino | 140.0 | 19600.0 | 2744000.0 | 15.936729 | train |
| ... | ... | ... | ... | ... | ... | ... | ... | ... | ... | ... | ... | ... | ... | ... |
| 393 | 27.0 | 4 | 140.0 | 86.0 | 2790 | 15.6 | 82 | usa | ford mustang gl | 86.0 | 7396.0 | 636056.0 | 25.826089 | test |
| 394 | 44.0 | 4 | 97.0 | 52.0 | 2130 | 24.6 | 82 | europe | vw pickup | 52.0 | 2704.0 | 140608.0 | 37.001105 | test |
| 395 | 32.0 | 4 | 135.0 | 84.0 | 2295 | 11.6 | 82 | usa | dodge rampage | 84.0 | 7056.0 | 592704.0 | 26.366302 | train |
| 396 | 28.0 | 4 | 120.0 | 79.0 | 2625 | 18.6 | 82 | usa | ford ranger | 79.0 | 6241.0 | 493039.0 | 27.777920 | train |
| 397 | 31.0 | 4 | 119.0 | 82.0 | 2720 | 19.4 | 82 | usa | chevy s-10 | 82.0 | 6724.0 | 551368.0 | 26.920402 | train |
392 rows × 14 columns
# Create the Altair chart using the predictions
alt.Chart(df).mark_circle().encode(
    x = 'horsepower',
    y = 'pred',
    color = 'label:N'

)
# what the true data looks like
alt.Chart(df).mark_circle().encode(
    x = 'horsepower',
    y = 'mpg'
)
Here are the coefficients. Based on what we were saying with the taxis dataset (“Oh look, the number of passengers is not very meaningful to the duration of the taxis ride, because the coefficient is pretty small”), you might think the “h2” and “h3” columns are not very meaningful here, because their coefficients are so small. But look at the values in these columns, they are huge (often over a million in the “h3” column), so even with these small coefficients, there is still a meaningful impact of these columns.
reg.coef_
array([-6.31876607e-01, 2.52981240e-03, -3.15086840e-06])
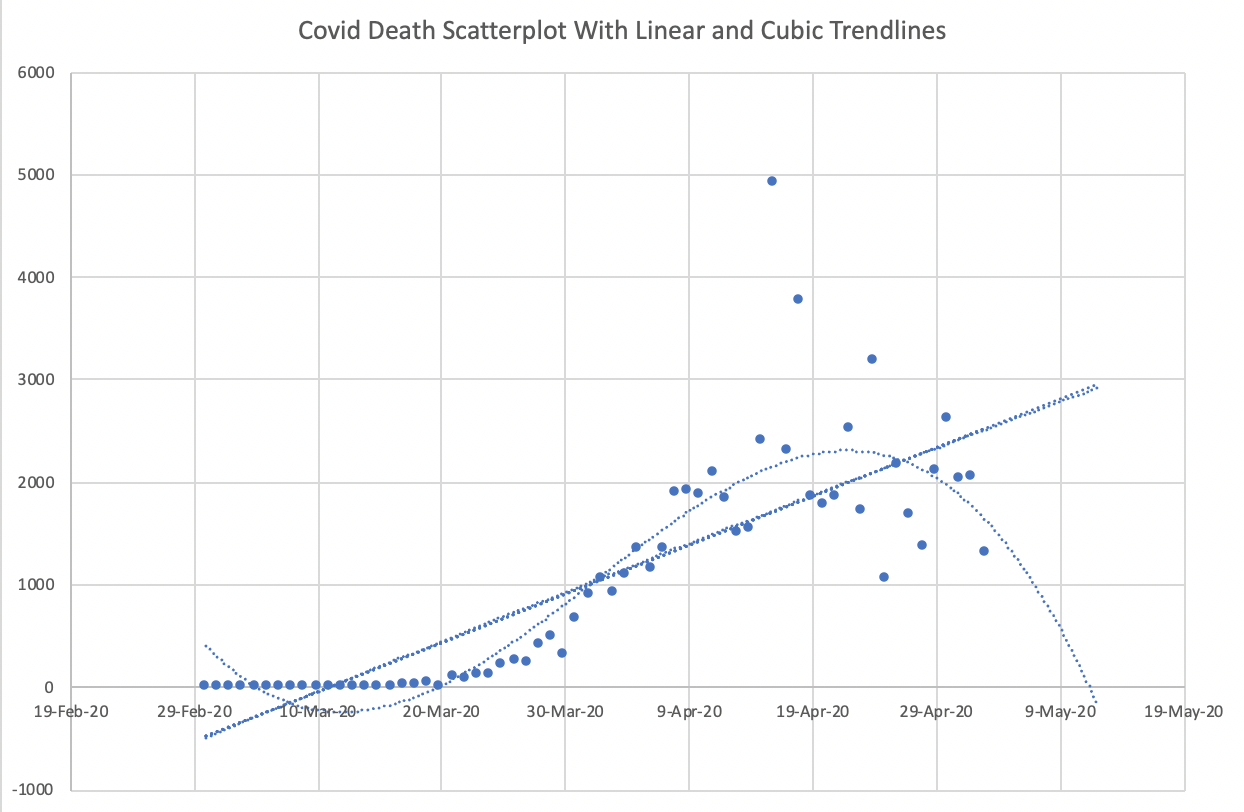
Warning: Don’t misuse polynomial regression#
Relevant quote:
“We are drowning in information but starved for knowledge.” John Naisbitt, Megatrends, 1982
 Created in Deepnote