Week 1 Friday#
Functions in Python#
A function is a block of organized, reusable code that is used to perform a single, related action.
Write a function
getsubwhich takes two inputs, a NumPyarrand an integern, and as output returns the subarray ofarrcontaining all rows with at least two entries equal ton.
A function with two input arguments. Be sure you are using the return statement to indicate what should be returned.
def getsub(arr, n):
    cts = (arr == n).sum(axis = 1)
    subarr = arr[cts >= 2]
    return subarr
import numpy as np
rng = np.random.default_rng(seed = 1)
arr = rng.integers(0,4, size = (100,3))
arr
array([[1, 2, 3],
       [3, 0, 0],
       [3, 3, 0],
       [1, 3, 1],
       [1, 3, 1],
       [1, 2, 2],
       [0, 0, 3],
       [3, 3, 2],
       [3, 1, 1],
       [3, 0, 1],
       [0, 1, 3],
       [0, 1, 1],
       [3, 0, 2],
       [1, 0, 3],
       [0, 1, 1],
       [1, 0, 3],
       [2, 3, 0],
       [2, 1, 2],
       [3, 1, 2],
       [0, 1, 3],
       [1, 2, 1],
       [0, 1, 2],
       [1, 3, 1],
       [2, 3, 3],
       [1, 0, 2],
       [2, 3, 1],
       [1, 0, 1],
       [2, 3, 3],
       [0, 2, 3],
       [1, 1, 3],
       [2, 2, 2],
       [2, 3, 3],
       [0, 0, 2],
       [3, 0, 2],
       [3, 3, 3],
       [0, 2, 3],
       [1, 0, 1],
       [0, 0, 3],
       [2, 3, 3],
       [3, 1, 1],
       [2, 1, 3],
       [0, 3, 2],
       [1, 2, 1],
       [3, 3, 1],
       [1, 0, 2],
       [2, 3, 3],
       [3, 3, 3],
       [0, 0, 1],
       [1, 3, 3],
       [1, 2, 2],
       [3, 0, 1],
       [2, 1, 3],
       [3, 3, 1],
       [3, 0, 2],
       [1, 0, 2],
       [3, 3, 0],
       [3, 3, 1],
       [0, 3, 3],
       [1, 0, 0],
       [1, 3, 1],
       [0, 2, 2],
       [0, 2, 1],
       [2, 0, 2],
       [1, 2, 1],
       [2, 0, 1],
       [2, 3, 1],
       [0, 2, 2],
       [2, 0, 1],
       [3, 3, 1],
       [2, 0, 3],
       [1, 1, 3],
       [2, 3, 0],
       [3, 3, 0],
       [0, 0, 1],
       [1, 0, 3],
       [1, 3, 3],
       [0, 2, 3],
       [0, 0, 1],
       [0, 1, 1],
       [2, 2, 1],
       [0, 2, 1],
       [3, 2, 2],
       [2, 1, 1],
       [1, 2, 1],
       [0, 0, 0],
       [0, 1, 1],
       [0, 1, 2],
       [1, 3, 2],
       [0, 3, 3],
       [3, 0, 3],
       [2, 3, 2],
       [2, 1, 3],
       [3, 2, 1],
       [2, 2, 0],
       [0, 1, 2],
       [0, 1, 0],
       [3, 2, 1],
       [3, 3, 1],
       [3, 3, 3],
       [2, 3, 0]])
getsub(arr, 3)
array([[3, 3, 0],
       [3, 3, 2],
       [2, 3, 3],
       [2, 3, 3],
       [2, 3, 3],
       [3, 3, 3],
       [2, 3, 3],
       [3, 3, 1],
       [2, 3, 3],
       [3, 3, 3],
       [1, 3, 3],
       [3, 3, 1],
       [3, 3, 0],
       [3, 3, 1],
       [0, 3, 3],
       [3, 3, 1],
       [3, 3, 0],
       [1, 3, 3],
       [0, 3, 3],
       [3, 0, 3],
       [3, 3, 1],
       [3, 3, 3]])
Properly formatted code can help in preventing errors.
def getsub(arr, n):
cts = (arr == n).sum(axis = 1)
subarr = arr[cts >= 2]
return subarr
  Cell In [5], line 2
    cts = (arr == n).sum(axis = 1)
    ^
IndentationError: expected an indented block
There aren’t any 5 values in this array, so that’s why the following returns an empty array.
getsub(arr, 5)
array([], shape=(0, 3), dtype=int64)
Why pandas?#
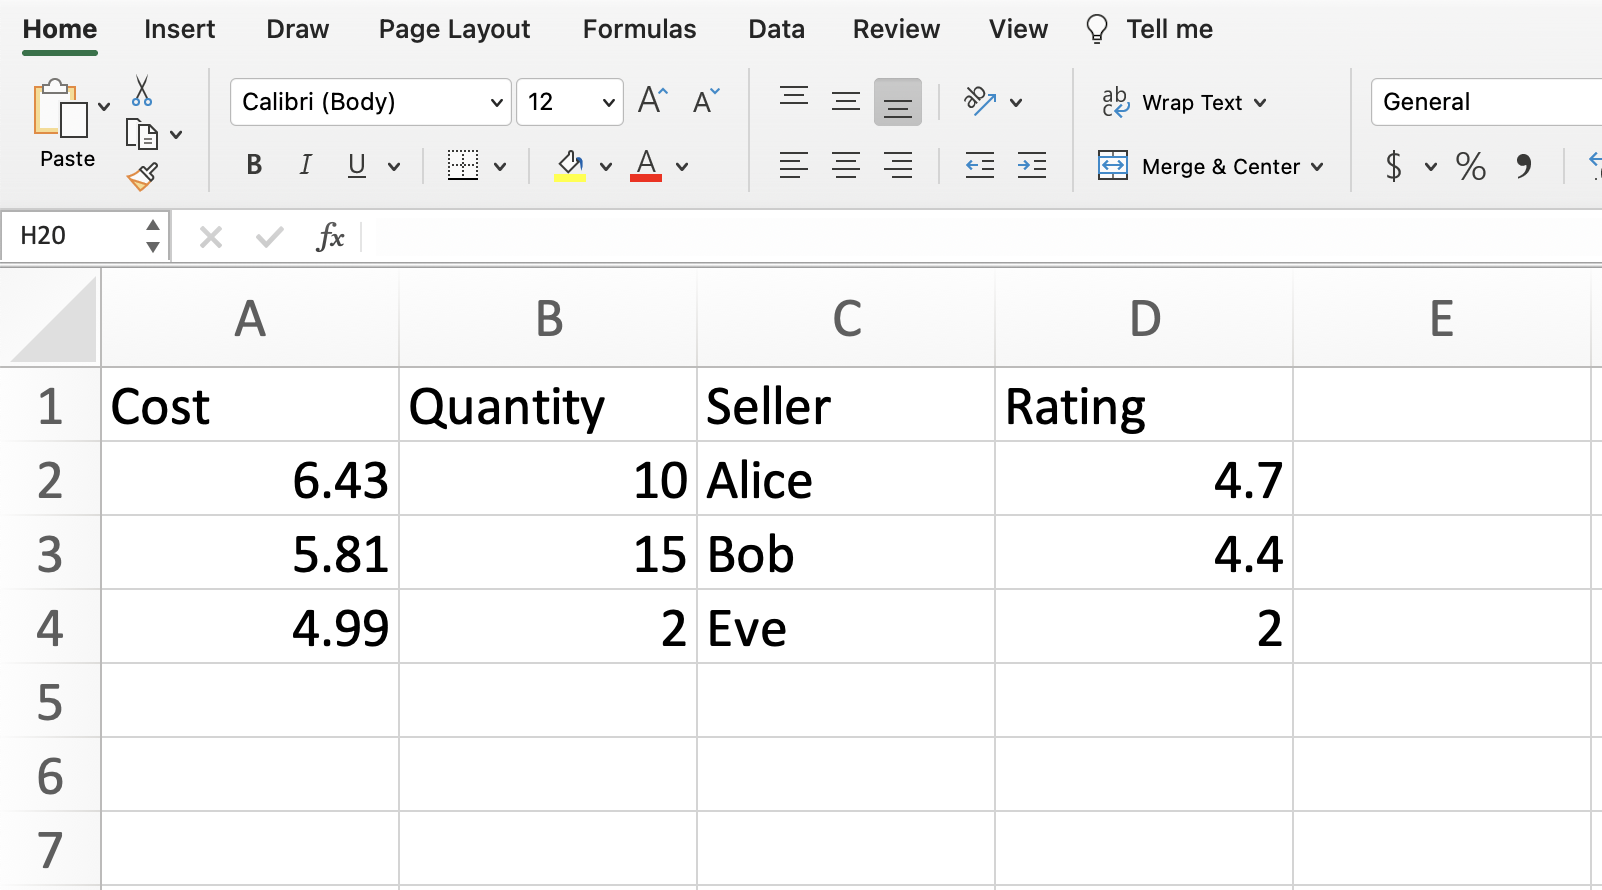
Imagine we have made our own tiny dataset like the following. It’s shown here and is attached to Deepnote as the file our-own.csv. Most of the data files we work with will be csv files (which stands for comma-separated values). Working with Excel files (xlsx files) is basically the same, but there is an extra step, so I usually would recommend converting to a csv file first.
What approach could we use to represent this in Python?
Wrong approach 1: as a list of lists#
Here is a pure Python approach (not using any libraries) where we represent the data as a list of lists. We’re skipping the column names, but that’s not the biggest issue.
our_list = [
        [6.43, 10, "Alice", 4.7],
        [5.81, 15, "Bob", 4.4],
        [4.99, 2, "Eve", 2]
    ]
Compute the average value in the “Rating” column (the column at index
3).
Any approach using this list-of-lists data type is inevitably going to be a little awkward.
type(our_list)
list
Convenient slicing for multiple dimensions does not work with our list of lists.
our_list[:,-1] # not a numpy array
---------------------------------------------------------------------------
TypeError                                 Traceback (most recent call last)
Cell In [8], line 1
----> 1 our_list[:,-1]

TypeError: list indices must be integers or slices, not tuple
Some practice with for loops.
for inside_list in our_list:
    print(inside_list)
[6.43, 10, 'Alice', 4.7]
[5.81, 15, 'Bob', 4.4]
[4.99, 2, 'Eve', 2]
We start out making a list of ratings. We use the append method (that is available for any list) to put the ratings onto the end of the rating list, one at a time.
rating = []
for inside_list in our_list:
    #print(inside_list[-1])
    rating.append(inside_list[-1])

rating
[4.7, 4.4, 2]
We now compute the average. Notice the small rounding error (the true answer is exactly 3.7). These sorts of rounding errors are pretty much inevitable when working with floats (decimal values) in Python.
sum(rating)/len(rating)
3.7000000000000006
Be careful testing equality == with floats in Python.
# be careful with numerical precision
# that's also true in NumPy and pandas
sum(rating)/len(rating) == 3.7
False
The following simple computation already fails. (Using equality is safer when working with integers instead of floats.)
0.1 + 0.1 + 0.1 == 0.3
False
Append a string onto the end of it. (We can make strings using either single or double quotation marks)
new_list = rating
new_list.append('Friday')
new_list
[4.7, 4.4, 2, 'Friday']
rating
[4.7, 4.4, 2, 'Friday']
Because we used copy, the original ratings list did not change.
rating = [4.7, 4.4, 2]
new_list = rating.copy()
new_list.append('friday')
print(new_list)
print(rating)
[4.7, 4.4, 2, 'friday']
[4.7, 4.4, 2]
Wrong approach 2: as a NumPy array#
It might be surprising that NumPy also does not work great for this data.
Convert our_list to a NumPy array.
our_arr = np.array(our_list)
print(our_arr) #Notice the quotation marks.
print(type(our_arr))
[['6.43' '10' 'Alice' '4.7']
 ['5.81' '15' 'Bob' '4.4']
 ['4.99' '2' 'Eve' '2']]
<class 'numpy.ndarray'>
If we check the type, we are told this is some NumPy version of a string. (It should be a number!) The problem is the column of seller names. NumPy wants homogeneous data, where all data types are the same within an array. But our data set is most naturally made using different data types in different columns. That is a problem that will be solved using pandas.
type(our_arr[0,1]) #string not integer
numpy.str_
# if all data types are numbers
our_list2 = [
        [6.43, 10,  4.7],
        [5.81, 15, 4.4],
        [4.99, 2, 2]
    ]
print(np.array(our_list2))
[[ 6.43 10.    4.7 ]
 [ 5.81 15.    4.4 ]
 [ 4.99  2.    2.  ]]
our_arr[0,1] + our_arr[0,1]
'1010'
'10' + '10'
'1010'
We can convert to floats using the astype method.
our_arr[:,0].astype(float)
array([6.43, 5.81, 4.99])
Right approach: as a pandas DataFrame#
The most important Python library in Math 10 is the pandas library. pandas is like the Python version of Excel.
Convert
our_listto a pandas DataFrame.
import pandas as pd
pd.DataFrame(our_list)
| 0 | 1 | 2 | 3 | |
|---|---|---|---|---|
| 0 | 6.43 | 10 | Alice | 4.7 |
| 1 | 5.81 | 15 | Bob | 4.4 |
| 2 | 4.99 | 2 | Eve | 2.0 |
Actually it’s better to import directly from the csv file.
Read in the data directly from
our-own.csvusing the pandas functionread_csvand store it with the variable namedf.
One advantage of this approach: the column names show up.
df = pd.read_csv('our-own.csv')
df
| Cost | Quantity | Seller | Rating | |
|---|---|---|---|---|
| 0 | 6.43 | 10 | Alice | 4.7 |
| 1 | 5.81 | 15 | Bob | 4.4 |
| 2 | 4.99 | 2 | Eve | 2.0 |